by Andy Hickie

Drone image of Tarradale Through Time barrow cemetery dig, as featured in “Current Archaeology” November 2019.
Back in 2017, I caved in to the demands of consumerism, and purchased a new quadcopter, a Phantom 3 Advanced, which is equipped with a camera and GPS unit. I flew multiple flights around Avoch but, after a while, the novelty of seeing one’s house from the air at different angles and altitudes begins to wear thin, and I began to wonder what I could actually do with a drone. Having always had an interest in archaeology and, spurred on by seeing some of the images Alan Thompson of NOSAS had created, I decided to carry out a few experiments of my own.
My first flights took in locations such as the distillery and settlement at Mulchaich, and the features of Kinbeachie castle – sites which had already been mapped by Alan by drone, the results of which I could use as a ‘benchmark’ against which I could compare those of my own.
At the same time, I began experimenting with various flight planning apps which allow for off-line autonomous flight planning, as well as online platforms for image processing. I found that “DroneDeploy” and “Mapsmadeasy” combined provided a fairly user-friendly pipeline, whereby image capture and photogrammetry can produce georeferenced photomosaics and digital surface models (DSMs). These can then be imported into software such as QGIS for further processing.
Having found the software which satisfied my needs, I then turned my attention to potential sites which I could map – and decided on the cropmarks of the Barrow Cemetery at Tarradale. At this point, my intent was purely to satisfy my own curiosity – just to see what I could see, and how it would compare with the archaeology found at the forthcoming 2019 dig.
And so, on 10 June 2018, accompanied by my daughter Emma to act as co-pilot and “spotter”, I visisted Tarradale to map the area with the drone. I can still recall the excitement I felt as the images began to appear on the monitor of the remote controller, which showed the cropmarks were developing. However, my satisfaction was tempered somewhat when I got home and began to process the photographs. Although the cropmarks were indeed evolving, the crop was insufficiently ripe, and many of the details remained hidden (see image below).

Not knowing the precise rate at which crops ripened and when the crop marks would be best appreciated, I returned to Tarradale a week later on the 17 June. The photomosaic showed only minimal development of the crop marks (image below).

Unfortunately, due to work and family commitments, the next time I was able to visit Tarradale was not until a month later, on the 17th July. My initial thoughs on creating the photomosaic was that I was too late, as the crops had by now ripened considerably (see image below).

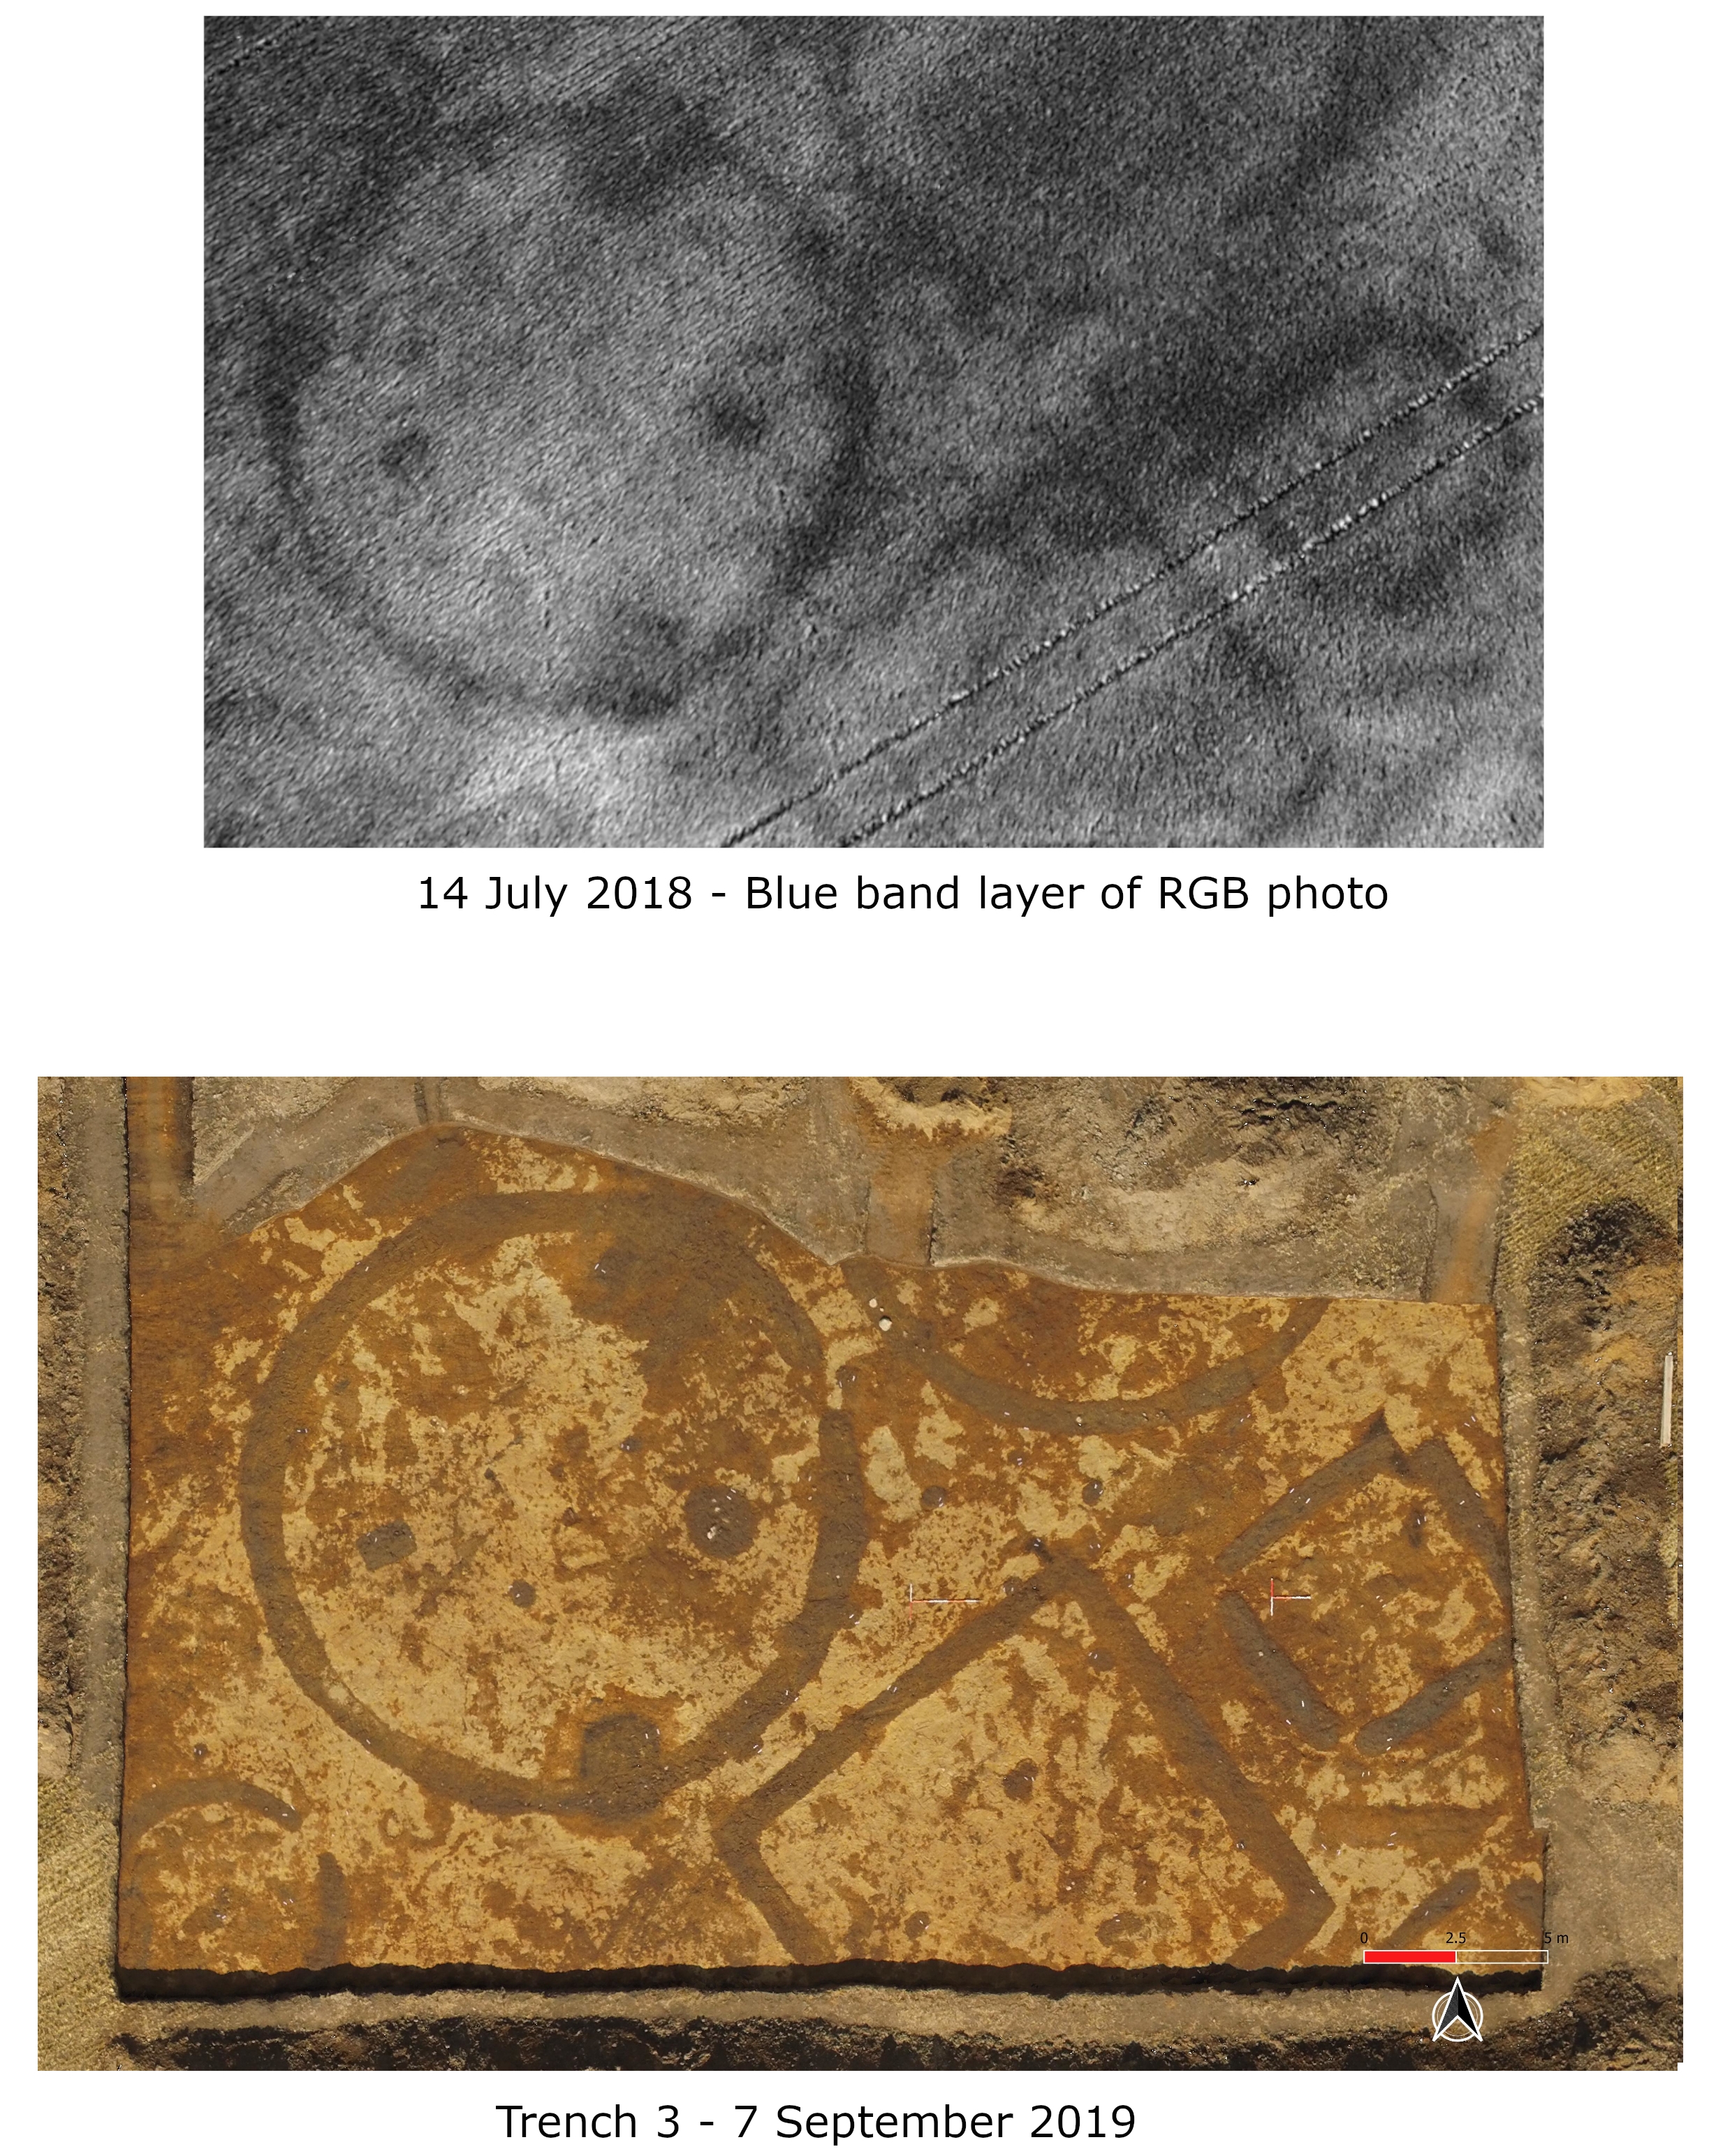
Notwithstanding, I sought ways of enhancing the cropmarks and tried several image processing algorithims, used in agriculture as ways of assessing crop health. In order to calculate these, the georeferenced image is first decomposed into its constituent red, green and blue channels in QGIS and then different mathematical formulae (of which there are many) applied to obtain Vegatation Indices. This approach met with varying, but only limited levels of success. Serendipitously, though, I noticed that the blue channel, with a +/-2sd contrast stretch, brought out the crop marks beautifully (image below).

Using the same process on selected frames, the crop marks were revealed in staggering detail (see images below). It should be borne in mind, at this point, that these images are derived fro the aerial photographs only – no mention yet of the Digital Surface Models!


We know that crop marks have two main characteristics – namely variation in crop colour, but also variations in height of the crop head. Using the photogrammetry derived DSMs, further processing can be done in QGIS using techniques normally associated with LIDAR. In particular, trend removal techniques can be applied, which seek to remove general large scale topographic variations, while enhancing local topography to – hopefully – reveal subtle height variations in the crop head, which may relate to the archaeology beneath. In this case, I processed the georeferenced DSM further, using a piece of software called the “Relief Visualistion Toolbox” to obtain a Simplified Local Relief Model (SLRM).
When the enhanced blue channel image is combined with the SLRM in QGIS, we can really start to appreciate what a palimpsest the Tarradale area is! The rig and furrow of later farming can clearly be seen, as can the sunken trackway, as well as the cropmarks of the barrow cemetery (image below).

But what of the archaeology? How well do the processed images relate to the features beneath? I shall leave you you to draw your own conclusions with this series of comparative images showing the cropmarks and aerial photographs of the September dig…


Created with GIMP

Hi Andy
I am doing an MA in Hull Uni into the investigation of crop marks using drones and automated software if you want to compare notes?
Some results can be seen at YAAMAPPING on facebook if you are interested?
LikeLike
Thanks for that! I shall have a look! Andy
LikeLike
Reblogged this on sideshowtog.
LikeLike